

Coal generation in China continues to fascinate the world, and for good reason. Last year’s emissions from that source alone were in the range of 6.1 billion tons of carbon dioxide, over double global aviation and shipping emissions combined. The big headlines in the past year were reserved for China’s extraordinary new coal plant licensing.
But China only permitted 10 GW of new coal generation in the first half of 2024, a drop of 83%. And coal capacity factors in the country continue to decline, even as wind and solar deployment reach new records annually. Further, China has long been in the habit of shutting down the worst of its coal plants and replacing them as needed with modern supercritical plants. Over 40% of its fleet are now modern supercritical plants burning higher grade, lower sulfur bituminous coal from mostly domestic sources, with lower carbon dioxide emissions per MWh as a result.
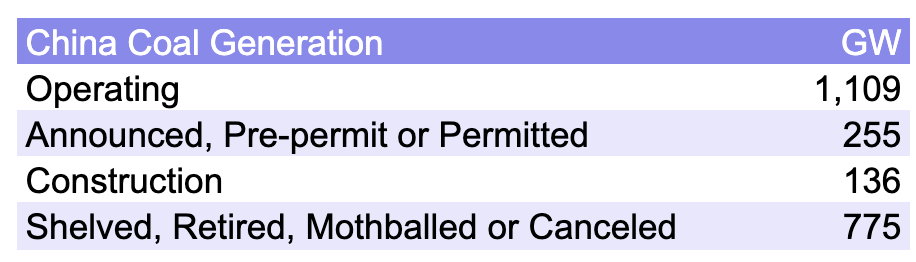
I aggregated this data from Global Energy Monitor reports several months ago when the China-bad coal permitting frenzy was at its peak. When 75% of operating capacity was matched by shelved, retired, mothballed or canceled plants, the question of coal generation in China becomes much more nuanced.
However, that’s still over 1.1 TW of coal generation capacity and more being built. Against that, 274 GW of wind and solar were connected to the grid in 2023, another record and likely a record that will fall every year through 2030. This leads to the reasonable question of what China’s electrical generation emissions might look like by 2030.
To answer this question, I first gathered data on coal, gas, nuclear, wind, solar, and hydroelectric GW of capacity as well as capacity factors for each of the years of 2015 through 2023. I then projected additions or retirements of capacity through 2030 from multiple sources — for example, looking at the World Nuclear Association list of nuclear generation facilities under construction, something I assessed along with newly approved nuclear plants recently.
The projection is far from perfect, as sources are of different quality, and in the cases of wind and solar, I simply assumed 10% and 20% higher installations per year through 2030, roughly in line with the past decade’s actual experience. That is, however, induction from the past and innumerable things could cause it to go both upward or downward. Similarly, for capacity factors for wind and solar, I projected a very slow improvement per year as operational, grid congestion, and other issues are resolved. In neither case do the capacity factors get anywhere near best of breed installations. By contrast, gas and coal generation capacity factors decline slowly over that period while nuclear remains flat at the average of levels from 2015 to 2023.
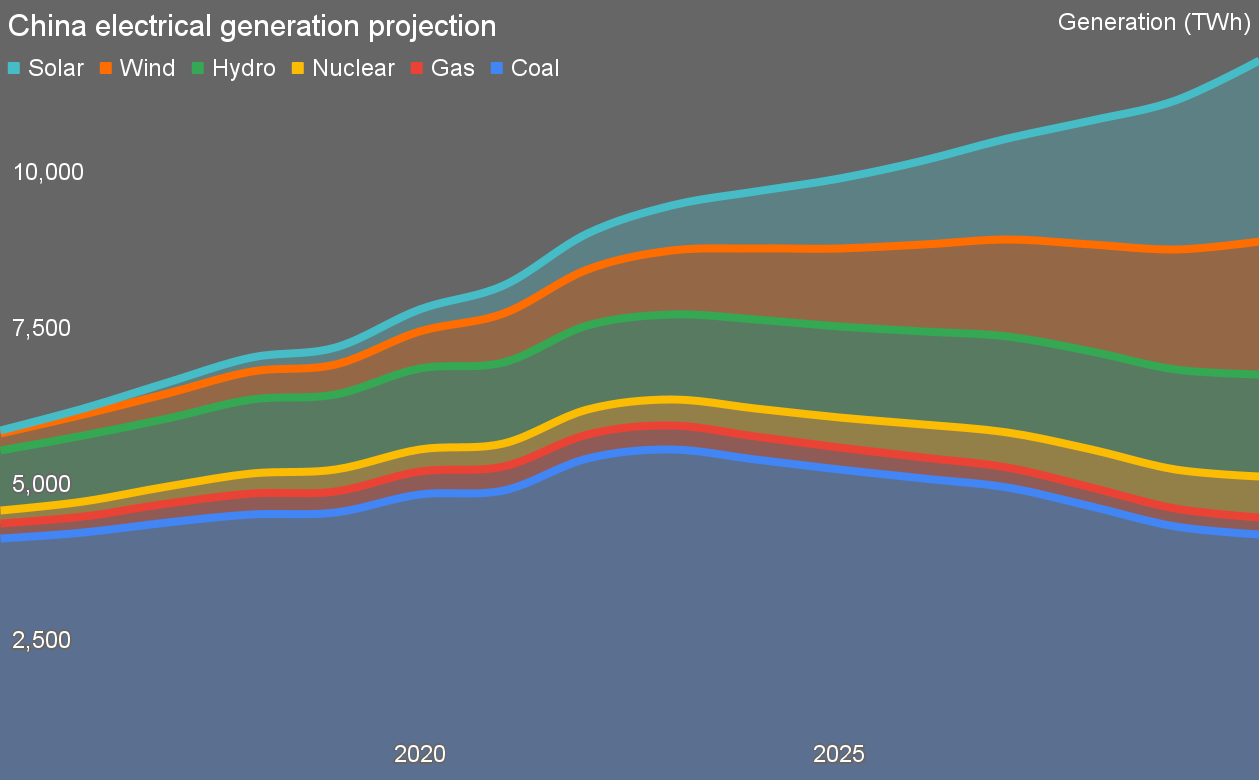
The resulting picture of generation is becoming starkly different than the last few years, and very quickly. Wind and solar under these reasonable projections have the potential to more than double as a percentage of the increasing pie of electrical generation, from around 20% to over 40%. Coal drops from almost 60% of electrical supply to about 34%.
Nuclear barely budges, the recently hyped plants under construction only shifting nuclear from just under 5% of total electrical generation to just under 6%. As a note, the construction schedule for the next few years vastly outstrips any nuclear construction history in China. While I’m fairly skeptical of the dates being met, I respected the plan nonetheless. It wouldn’t surprise me if nuclear’s contribution in China actually shrank in relative terms by 2030, but I’m giving it every benefit of the doubt, mostly to make the point that it’s just not doing the heavy lifting.
This, of course, turns into CO2 emissions. For this analysis, I kept it to CO2 and approximations based on the generation technology and fuel. China’s utility-scale solar having higher emissions full lifecycle due to the current coal-heavy manufacturing process was respected, bringing its emissions up above the historical western average, but still far under coal or gas of course. China’s increasing weighting of supercritical coal facilities saw slightly declining emissions per MWh over the years from 2015 to 2030. Nuclear was a bit above wind, as per lifecycle carbon assessments globally for a decade, but both are so much lower emissions that the variance is immaterial, as is the higher emissions of solar in the larger scheme.
Note that solar’s higher emissions are going to decline rapidly as well as China continues to electrify. Among other things, China has entirely stopped permitting coal-fired steel plants and is expanding electric arc furnaces fed with scrap where steel is required, and steel along with cement demand has dropped substantially as the infrastructure boom of the past decades draws to a close.
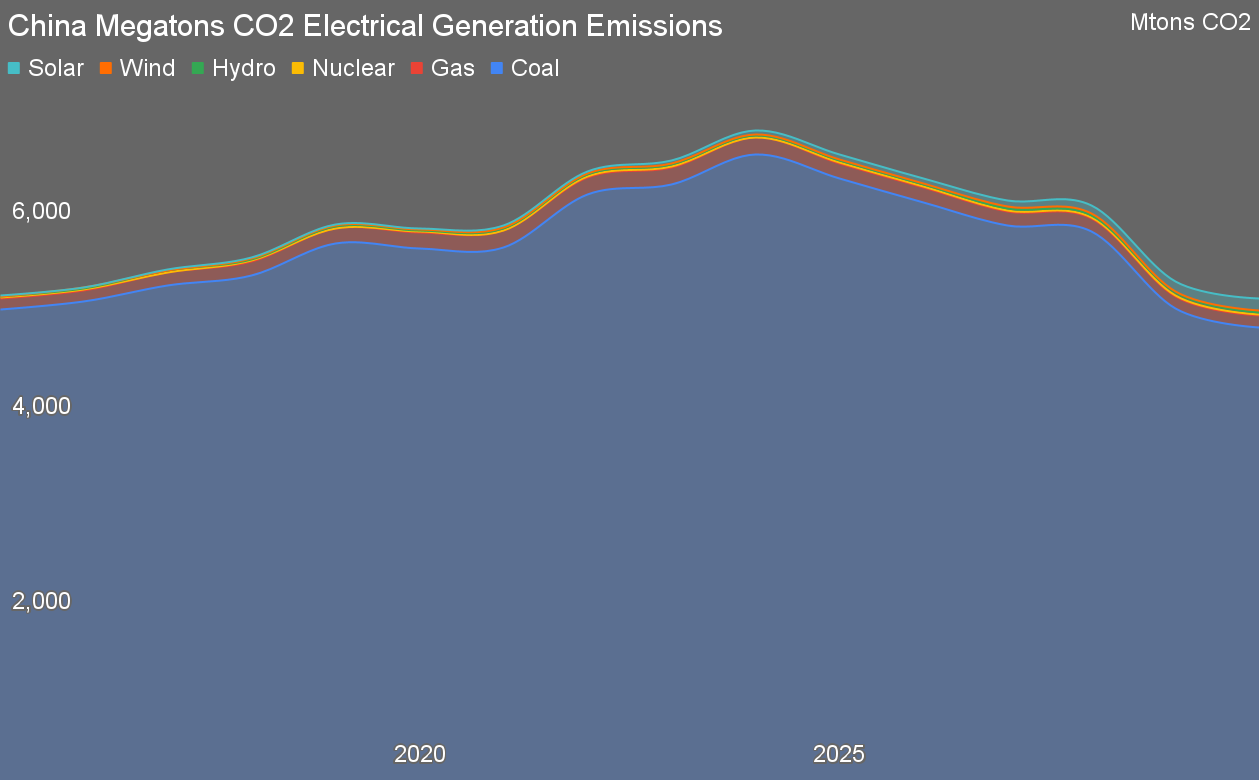
Assuming that the generation mix projections and capacity factors are roughly correct, this results in a significant decline in total emissions from the sector by 2030, over 20%.
China’s coal generation produces virtually all of the billions of tons of CO2 from their electrical generation sector. The news of China’s continued acceleration of wind and solar, the positive if much less material growth of nuclear, and the radical slowing of permitting for new coal generation combine to potentially reduce 15% of the world’s carbon emissions to around 12% in the coming seven years.
That’s while China continues to significantly increase its annual electrical generation and increase the electrification of its economy.
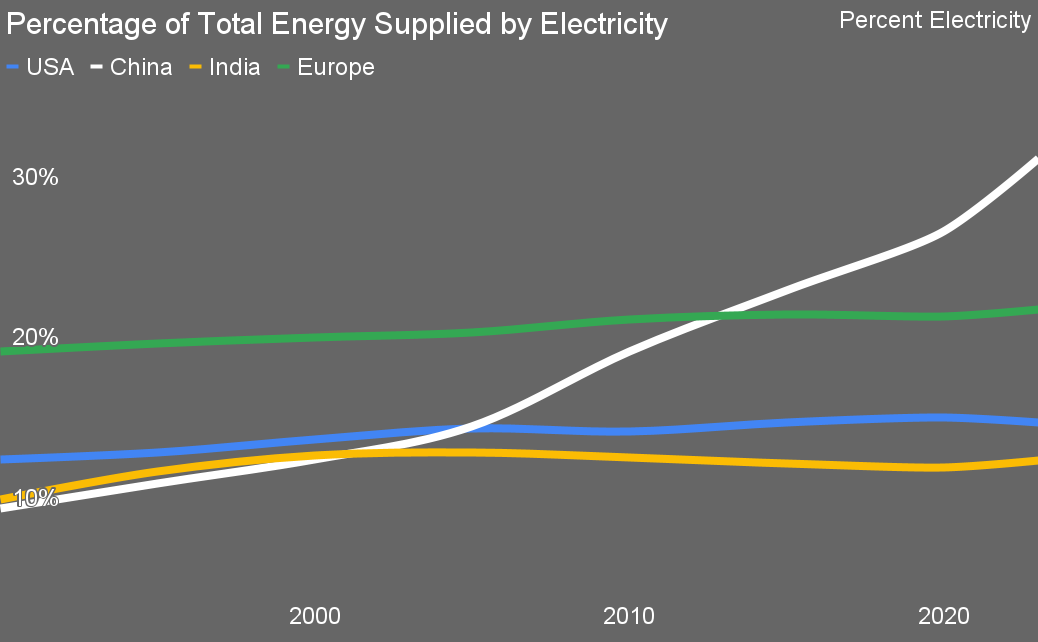
I developed this chart recently when considering the major economic regions of the world and their progress on the key climate change wedge of electrifying everything everywhere all at once. Out of the USA, India, Europe, and China, only China has radically increased the contribution of electricity as a percentage of all energy. That means that their transportation, heating, and industry have very significant and rapidly increasing energy efficiency advantages over the rest of the world.
As they decarbonize their electricity with low-cost renewables, that’s going to turn into yet another economic advantage for the country. Energy costs will be lower than the rest of the world because of the efficiency premium. Carbon debt of manufactured goods will be lower because fossil fuels won’t be used and the electricity will be much lower carbon. That means that things like Europe’s carbon border adjustment mechanism will not impact Chinese goods as much as goods from geographies that aren’t moving the needle.
And now a mea culpa. In 2018 I made a projection that suggested that while wind and solar were providing double the TWh per year of nuclear then, that they might be generating four times as much by 2030. This projection, which once again gives a significant benefit of the doubt to nuclear and merely repeats the curve of wind and solar for the past few years into the future, suggests it will be closer to eight times as much. In fact, it hit four times as much last year, six years ahead of my projection.
When it comes to scaling actual climate solutions, it always pays to look at what China is doing. It may have been a global whipping boy due to its high recent emissions and a healthy dash of Sinophobia, but the country has scaled most of the low-carbon technologies the world needs by deploying them massively itself. Tariffs upon Chinese clean technologies in North America and Europe are just going to kill western firms’ global competitiveness and slow their climate action as China accelerates past them.