

Fossil fuels, or energy sources formed in the Earth’s crust from decayed organic material, including petroleum, natural gas, and coal, continue to account for the largest share of energy production and consumption in the United States. In 2019, 80% of domestic energy production was from fossil fuels, and 80% of domestic energy consumption originated from fossil fuels.
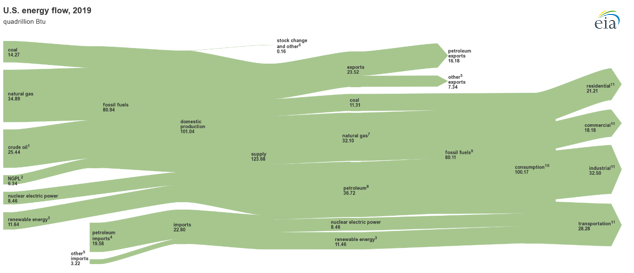
The U.S. Energy Information Administration (EIA) publishes the U.S. total energy flow diagram to visualize U.S. energy from primary energy supply (production and imports) to disposition (consumption, exports, and net stock additions). In this diagram, losses that take place when primary energy sources are converted into electricity are allocated proportionally to the end-use sectors. The result is a visualization that associates the primary energy consumed to generate electricity with the end-use sectors of the retail electricity sales customers, even though the amount of electric energy end users directly consumed was significantly less.

The share of U.S. total energy production from fossil fuels peaked in 1966 at 93%. Total fossil fuel production has continued to rise, but production has also risen for non-fossil fuel sources such as nuclear power and renewables. As a result, fossil fuels have accounted for about 80% of U.S. energy production in the past decade.
Since 2008, U.S. production of crude oil, dry natural gas, and natural gas plant liquids (NGPL) has increased by 15 quadrillion British thermal units (quads), 14 quads, and 4 quads, respectively. These increases have more than offset decreasing coal production, which has fallen 10 quads since its peak in 2008.

In 2019, U.S. energy production exceeded energy consumption for the first time since 1957, and U.S. energy exports exceeded energy imports for the first time since 1952. U.S. energy net imports as a share of consumption peaked in 2005 at 30%. Although energy net imports fell below zero in 2019, many regions of the United States still import significant amounts of energy.
Most U.S. energy trade is from petroleum (crude oil and petroleum products), which accounted for 69% of energy exports and 86% of energy imports in 2019. Much of the imported crude oil is processed by U.S. refineries and is then exported as petroleum products. Petroleum products accounted for 42% of total U.S. energy exports in 2019.

The share of U.S. total energy consumption that originated from fossil fuels has fallen from its peak of 94% in 1966 to 80% in 2019. The total amount of fossil fuels consumed in the United States has also fallen from its peak of 86 quads in 2007. Since then, coal consumption has decreased by 11 quads. In 2019, renewable energy consumption in the United States surpassed coal consumption for the first time. The decrease in coal consumption, along with a 3-quad decrease in petroleum consumption, more than offset an 8-quad increase in natural gas consumption.